Perform Fast Network Analysis on Real-Time Data With Memgraph
The first automated solutions that arrived in industries such as chemicals, supply chain management and telecommunications were a big refreshment to the traditional way of handling data which was oriented around managing clunky spreadsheets without a centralized component for storing information. Using databases as the central storage solved the problem of the unknown source of truth and allowed applications to consume and process the data.
With the arrival of big data, companies started to gather millions of data points. All that data needed to be processed and distributed among employees and users immediately to keep the low latency of information distribution. If systems were lagging, it was no longer because of the computers’ main processing power. The bottleneck shifted to storage.
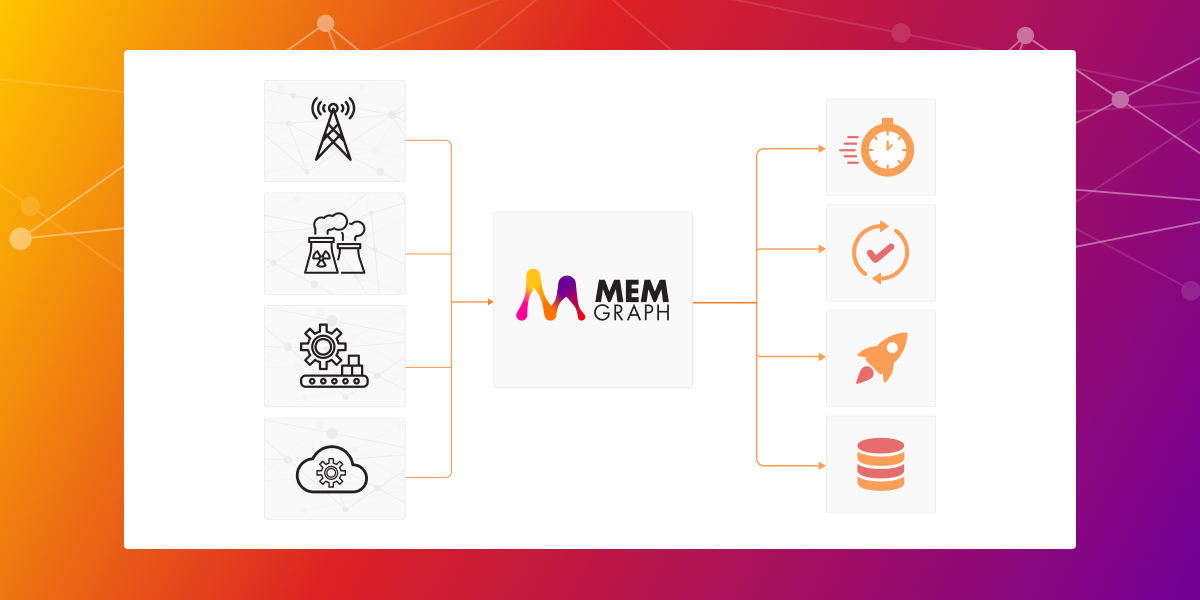
Relational databases were not designed to handle both the high amounts of writes in high-velocity systems, as well as complex online network analytics. The main problem is that relational databases are great for representing data sets but don’t handle topologies and networks very well. So graph databases are much better at this particular task, especially Memgraph, as a complete computational graph platform, with storage, visualizations, analytics, and streaming capabilities. So sit tight because there’s a lot of ground to cover!
Annihilate performance issues with in-memory storage
Around 25-35% of query processing time in companies working with networks and network resources is spent on loading topology. The main reason for slow performance is a relational database used as storage. However, changing the type of storage is not enough if the performance degradation is caused by loading a large dataset into memory from a disk.
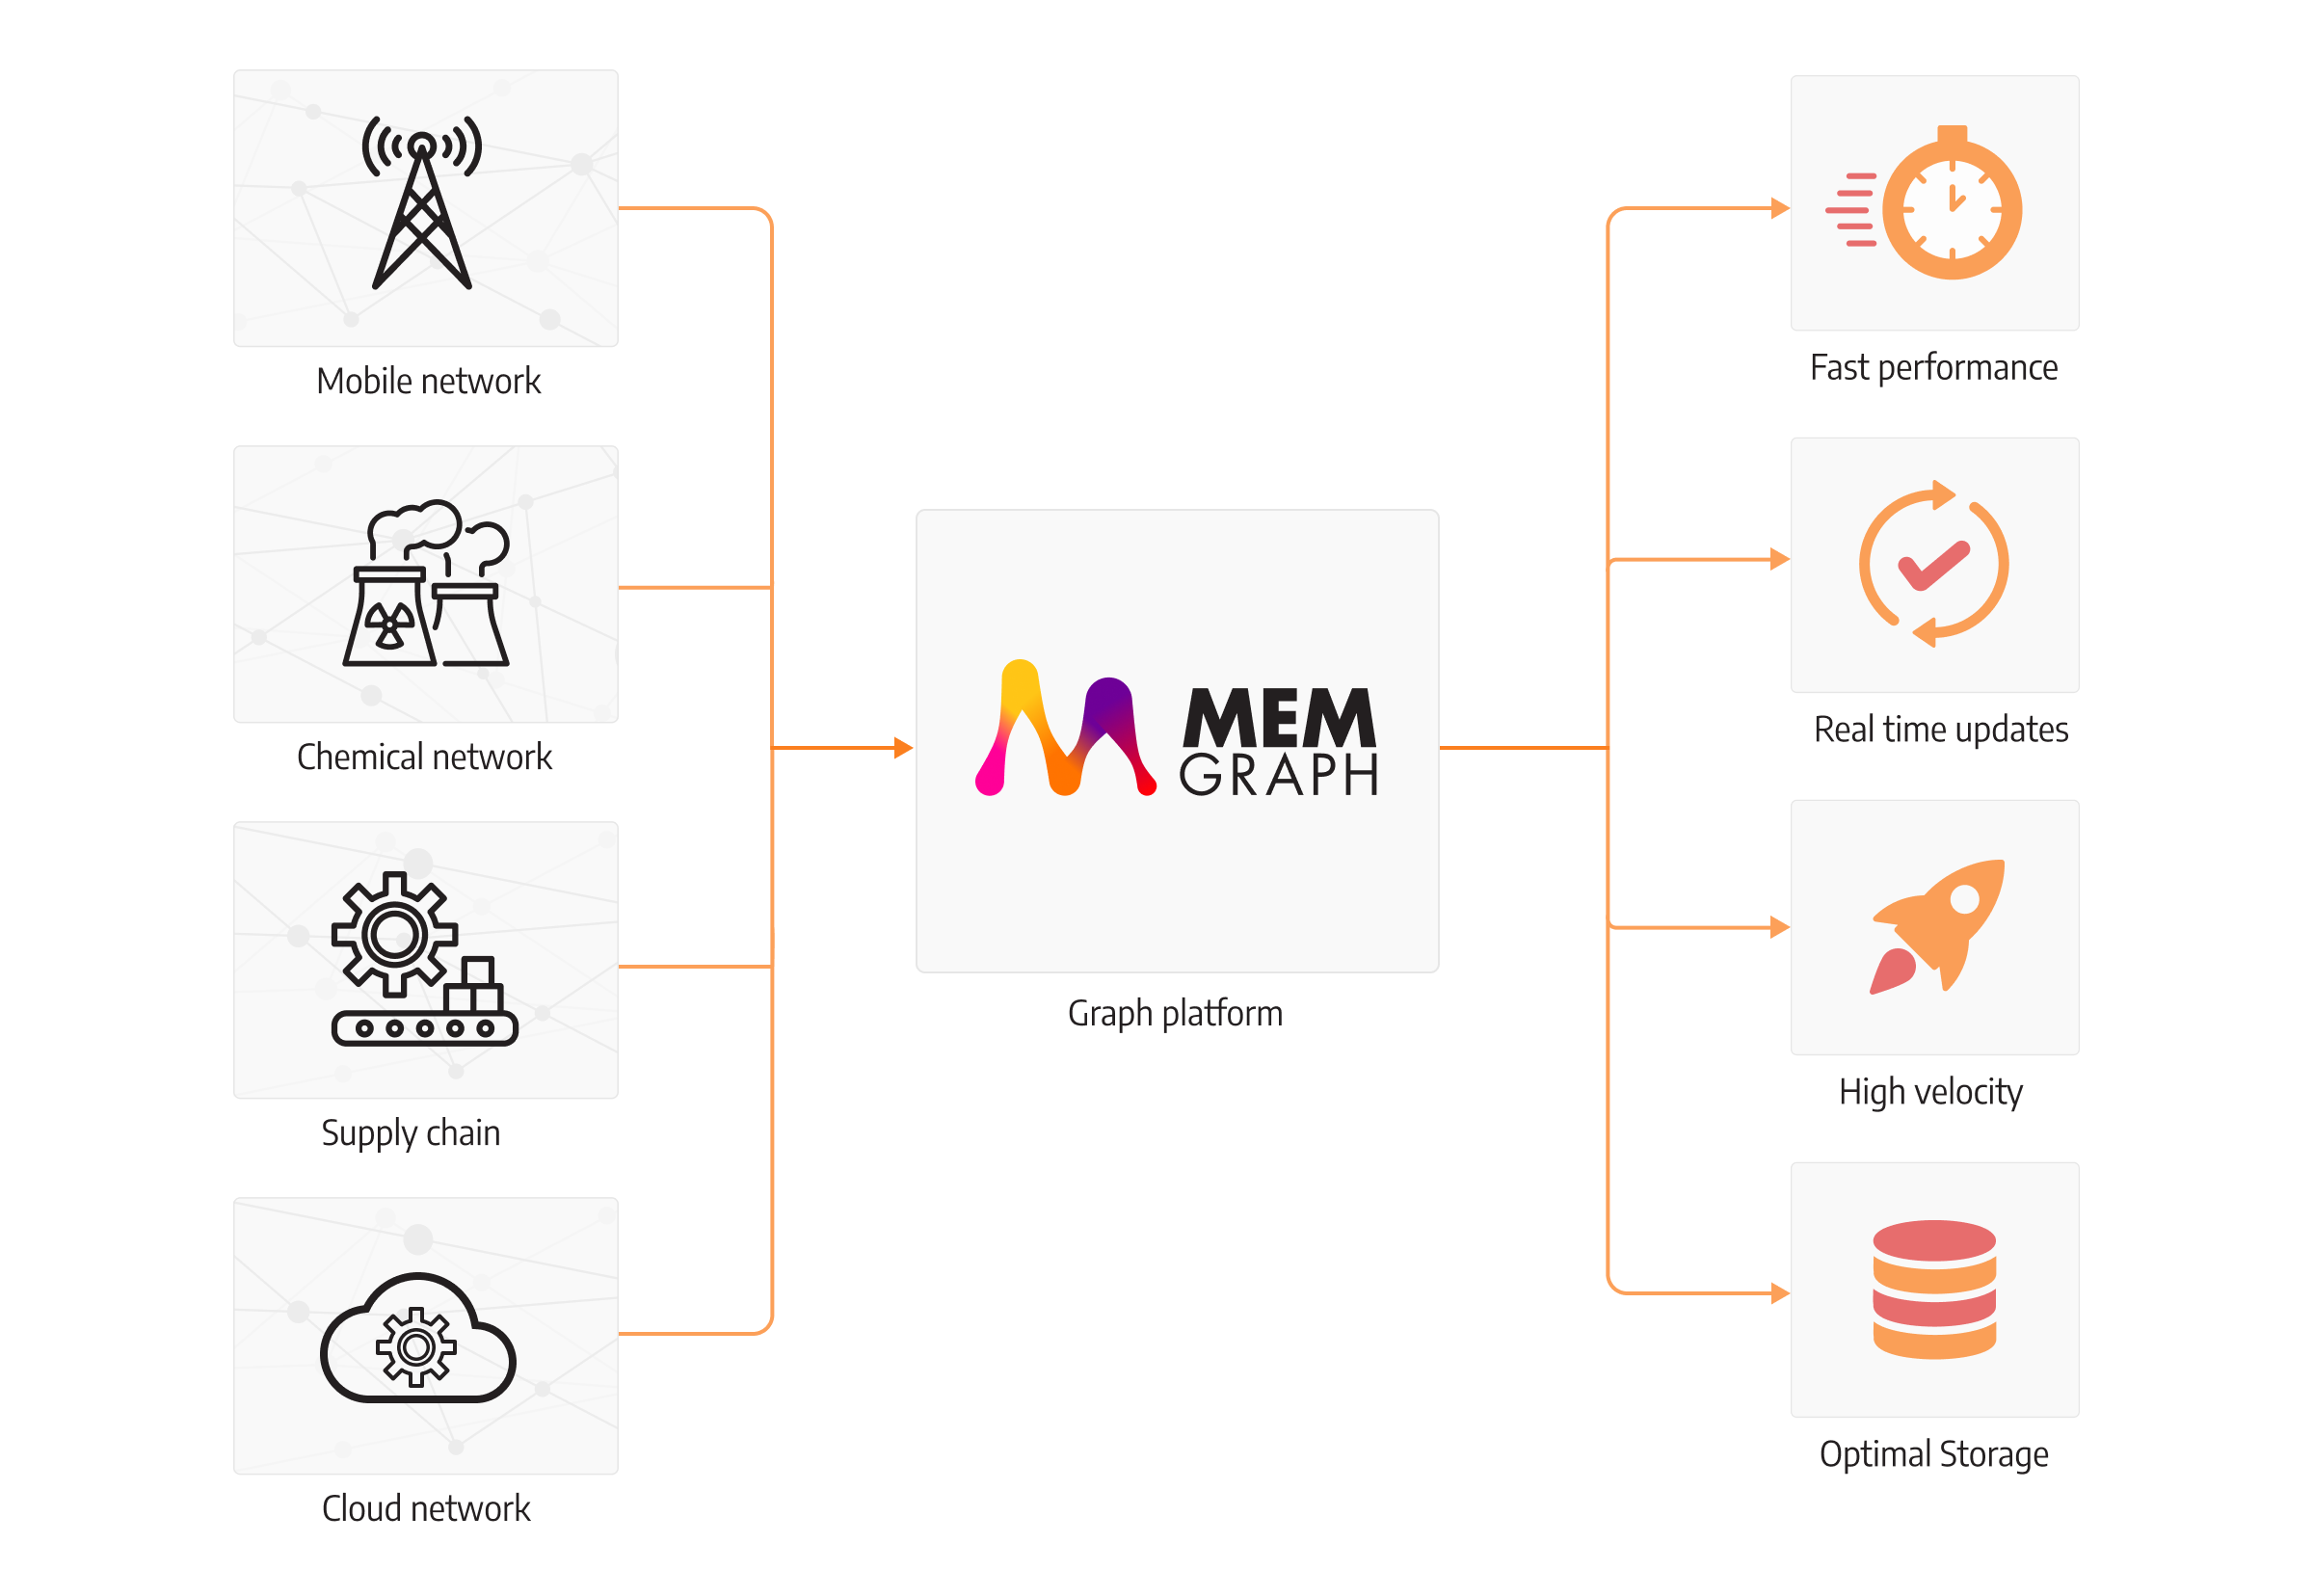
This is especially a problem in industries such as power management companies and chemical plants, which heavily rely on highly connected components (generators, reactors). Their networks sometimes consist of thousands of connected components. Just imagine how complex is the network of energy pipelines of a whole continent like Europe. Another performance degradation can happen when systems need to instantly execute new online analytics to correctly reflect the changes in supply and demand and provide companies with new information.
Mobile networks are another example of a network of highly connected data, with hundreds of mobile base stations with antennas a phone can connect to for establishing a call. Since mobile users are moving all the time, the system needs to efficiently re-assign new base stations to provide a stable connection.
The supply chain industry is a network of a vast number of production lines with different pipelines assembling products for shipping. To maximize production efficiently, the production schedule needs to be dynamically adjusted.
Memgraph, as a platform, offers an in-memory graph database. All the data is loaded into RAM during startup ensuring efficient querying, and the memory footprint is further reduced by efficient features written in C++. Graph storage has been designed to represent data networks and allows the speedy execution of complex traversing queries that can prepare the topology for analysis without friction. As networks of data are usually queried from a certain starting node expanding to nearest neighbors or subgraphs, the Cypher query language was designed to allow easy traversals, pathfinding, and loading of the necessary nodes and relationships for inspection.
All in all, graph databases are the solution to performance issues companies have to endure when faced with gigantic networks of highly connected data!
Answer your deepest network analysis questions with graph algorithms
In industries that heavily rely on networks, certain questions need to be answered. Let’s see what questions dominate which industries:
Supply chain management
In what order do tasks need to be executed so that my production lines are idle as little as possible during the day?
What are the dependencies of the product I want to make?
Given the current number of ingredients in stock, how many instances of the final product can I make in 5 hours?
Chemical engineering
What is the minimal number of sensors that need to be placed across my plant components to monitor variables in the system?
What is the maximum flow produced out of my system?
What’s the quantity of material across all the connections between reactors that yield maximum flow?
If I add a reactor to the network, does it increase production efficiency?
Mobile networks
How to assign codes to mobile base stations to ensure they all have distinct code numbers and that switching between base stations is executed correctly?
Power management systems
What are the 10 most critical points in my power grid that need to be strengthened to reduce the risk of a power outage?
Cloud computing
Given the current network traffic at the moment, how much of my resources should be provisioned?
The SQL query language used with relational databases was designed to aggregate lists of data, not traverse the network. The task of formulating a query to answer any of these questions regarding network analytics is extremely complex.
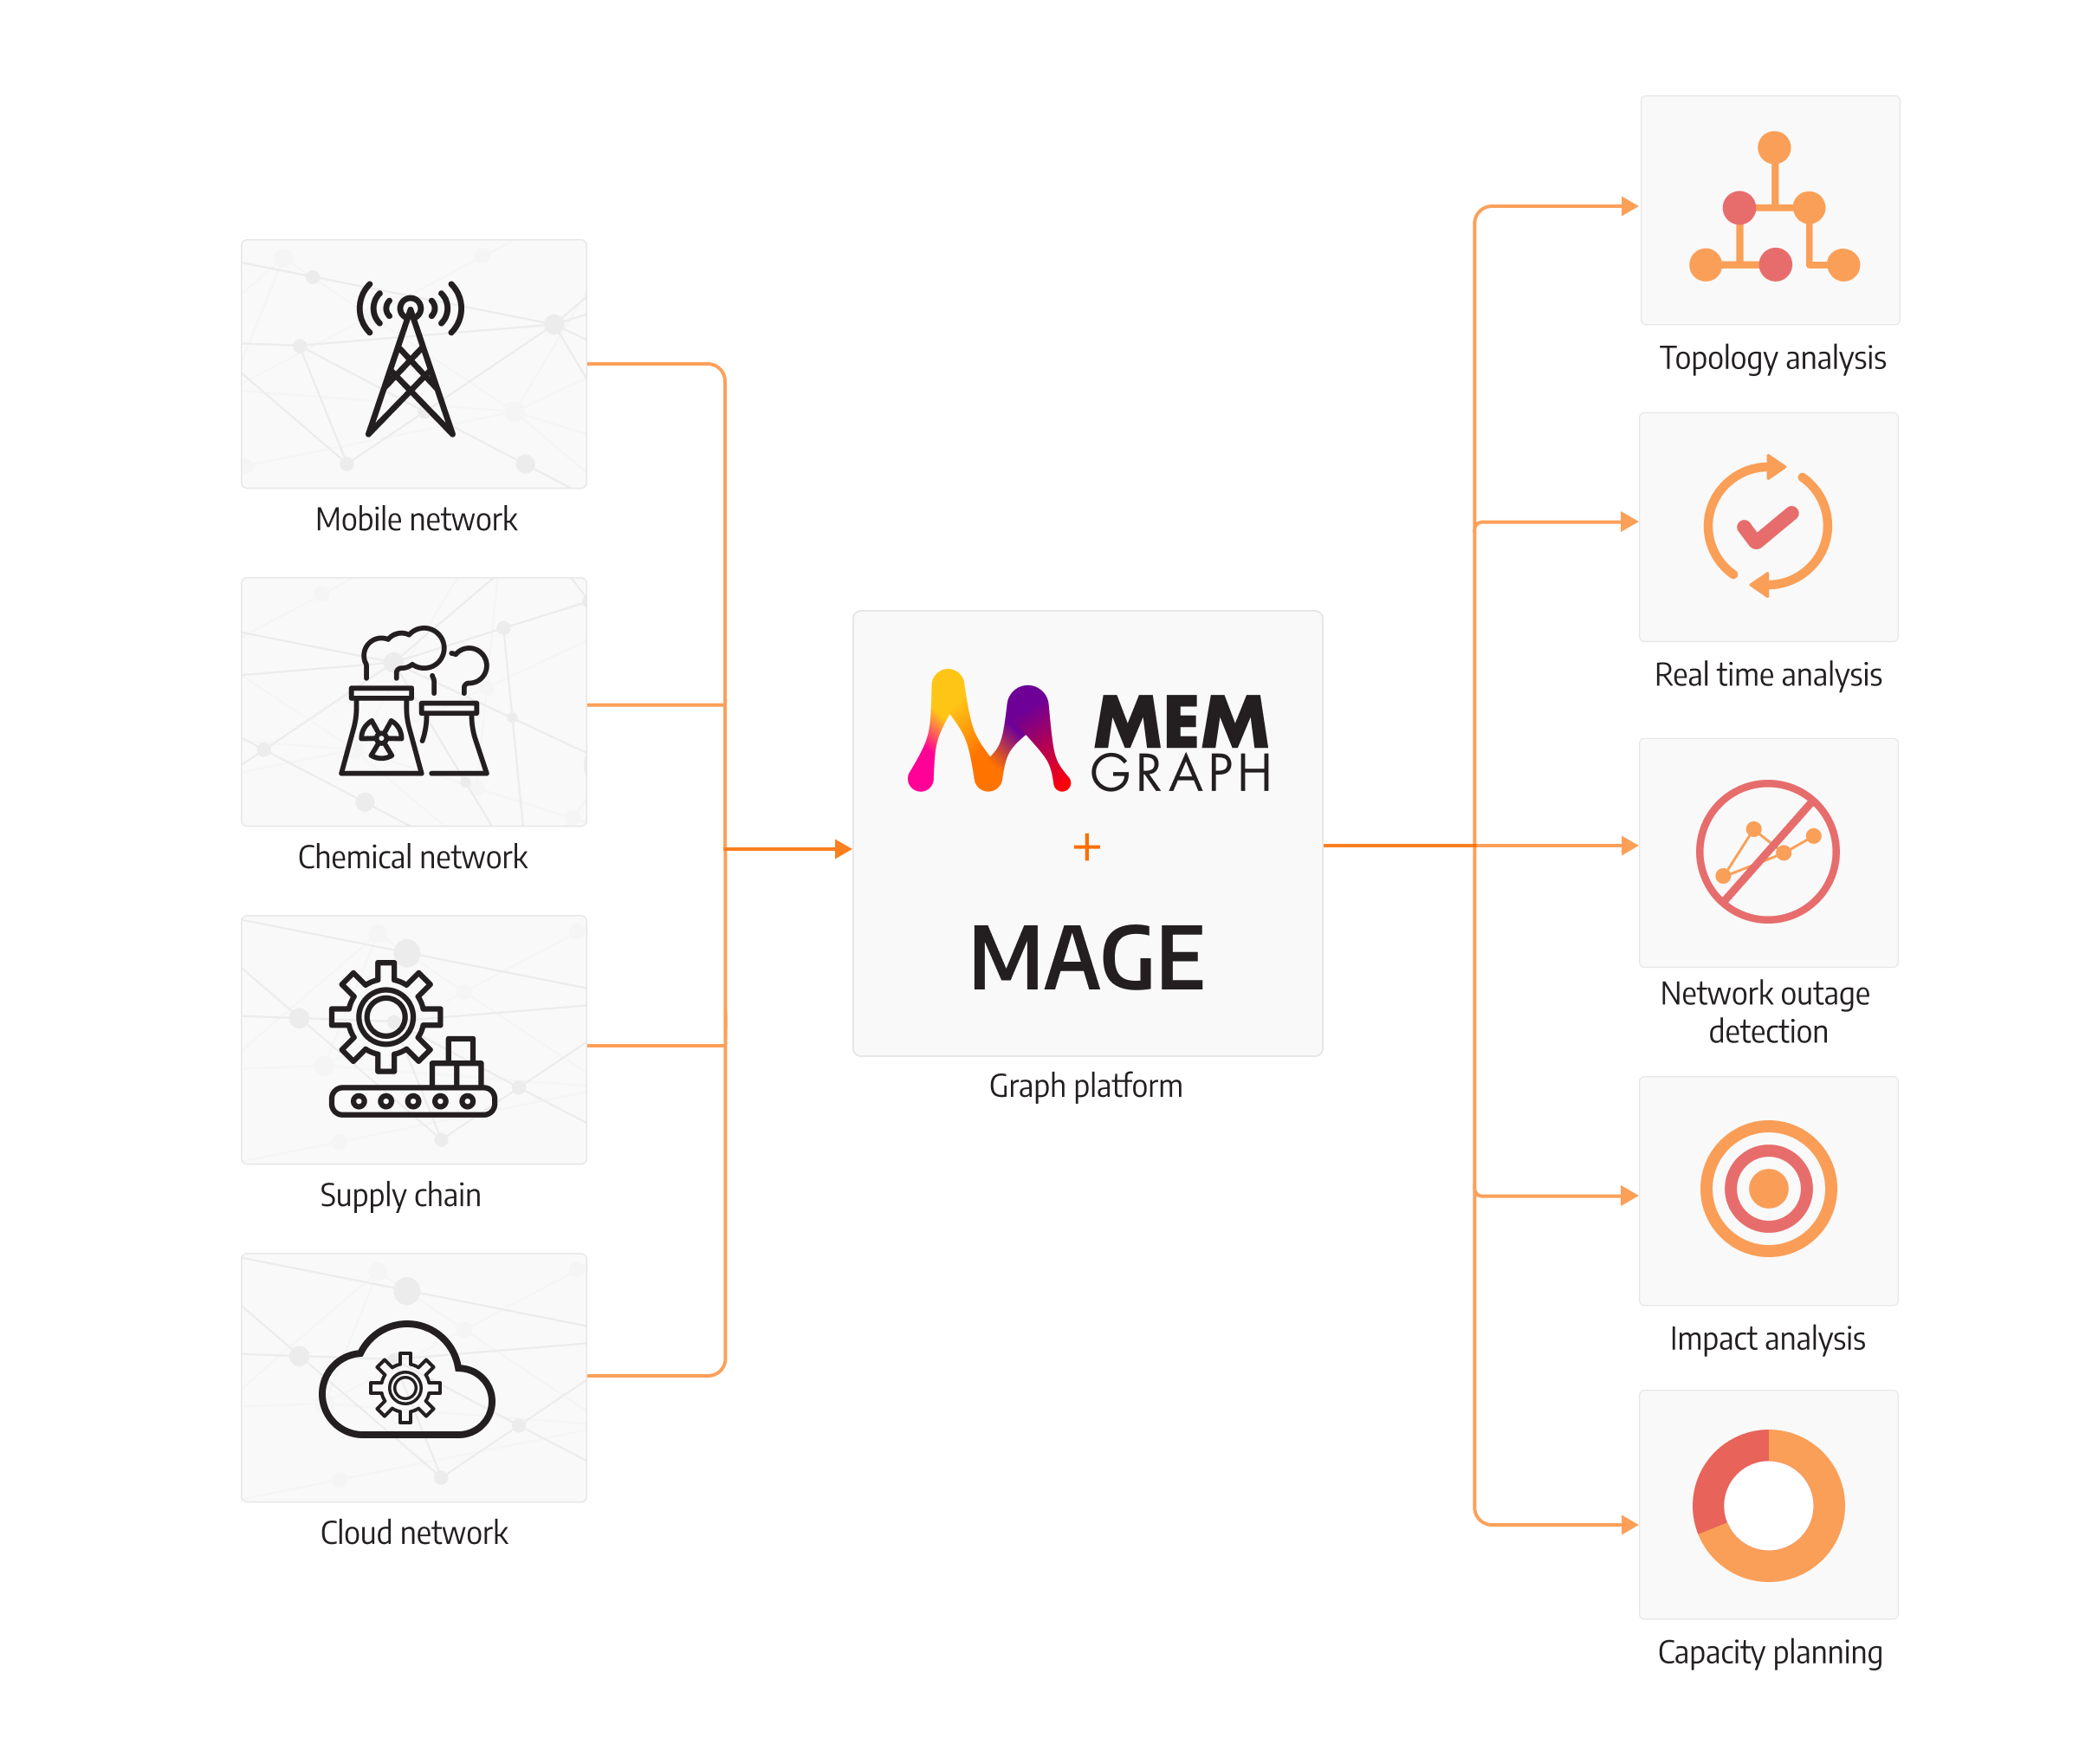
Although Cypher easily solves tasks involving network traversals, these queries might be too complex to write even in that language. To make every data analyst’s life easier, Memgraph has developed an open-source library of graph algorithms and integrations with various graph tools called Memgraph MAGE Memgraph Advanced Graph Extensions. The library consists of query modules that can be called and executed inside Cypher queries to perform advanced analytics and gain insights from the network storage. Centrality algorithms like PageRank or betweenness centrality, community detection algorithms, and even Graph Machine Learning are now possible to be executed directly on the database level to reduce latency and give immediate insights.
Let’s look at a few examples of calling these algorithms to answer the questions above:
What are all of the dependencies of the made product?
MATCH (n:Node {id:1})
CALL graph_util.descendants(n)
YIELD descendants
RETURN descendants;
The algorithm above yields all descendants of the source node, from which another node can be reached by following directed paths in the graph. It would give us a good amount of information about which products in the supply chain are followed after a certain process.
What are the top 10 critical places in my power grid that need to be strengthened, reducing the risk of power outage?
CALL betweenness_centrality.get()
YIELD node, betweenness_centrality
SET node.rank = betweenness_centrality
RETURN node, betweenness_centrality
ORDER BY betweenness_centrality
LIMIT 10
Betweenness centrality can yield critical hub points in the graph, through which a majority of paths between pairs of nodes are passing. It would be an excellent indicator of weak points that could help prevent power outages between 2 distinct areas in the country or analyze critical points in the supply chain pipeline.
These are only two answered questions, but all of them mentioned above can be answered with graph algorithms or traversal analytics on the data inside the Memgraph database. The result - analytical queries written with ease to gain instant network analysis insights!
But what if you need some algorithm that isn’t available in the library?
There is an answer to it as well! MAGE is open source and highly extendable with additional graph algorithms or custom analytics. APIs for integrating with MAGE accept Python, C++, Rust and C language for seamless integration with your own query modules to solve business problems in your company! To learn more about query modules, you can check out our how-to guides to implementing a Python query module or a C++ query module.
If you want to know how easy it is to work with graph algorithms on a real use case, such as telecommunications, we have made a tutorial to showcase how to optimize assigning mobile phone signals to correspondent base stations.
Stay up-to-date with real-time streaming capabilities and dynamic graph algorithms
One of the bigger issues when dealing with a large number of updates in the network state is keeping up with the real-time demands and providing up-to-date information. Even though relational databases can handle a large number of writes in the database, the challenge of recomputing the answers to the questions asked above becomes unbearable and they can no longer guarantee to provide the latest insights.
Unable to keep up with real-time analytics, companies turn to processing data in batches and recomputing information from all the data points at fixed points during the day or night (e.g. nightly reports). However, some situations require updates as soon as new data comes in.
For example, if the flow of materials in the chemical reactor changes, the parameters in the network need to be adjusted without delay. There can be multiple different chemical reactions happening in the same component at different times, so conditions need to be updated in real-time for safety reasons.
On the other hand, if the chemical plant is still being constructed, a simulation of a digital twin needs to be run enough times to decide what is the most fitting topology for the purpose (e.g. Monte Carlo simulations).
Sometimes, we need to react quickly, not only to prevent things from escalating but also to fix unexpected situations that have already happened. In cloud computing, when there is a suspiciously high amount of fees that need to be paid for computing resources, a root-cause analysis needs to be performed in order to detect the cause of spending extra budget on unused resources and cut the spending.
All of these examples have an identical weakness - can they be performant enough if the number of updates rises per unit of time (increasing the data velocity) to provide crucial information the moment they are required? Can they be performant if the number of updates is fairly low, but the amount of time it takes to recompute all the insights still doesn’t meet the real-time expectations of making updates? Even if the computer is high-performant by itself, recomputing insights from a changed graph has to be done in real-time.
To achieve high performance with a large number of updates is to recompute results from the local change in the graph without recomputing results on the whole network. Memgraph extensively researched how to tweak the traditional graph algorithms to handle streaming data and created dynamical graph algorithms. Combined with database triggers, they offer a powerful solution to stay up to date with the newest information from the network, no matter how fast data in the network changes!
To ease up collecting data from streams as much as possible, a “portal” has been opened for message queues, such as Kafka, Redpanda and Pulsar. Memgraph can quickly plug and play to receive streaming data in an instant, therefore connecting the graph from the get-go.
Observe new patterns by inspecting visualized data
If you somehow managed to get intelligence from the painstakingly written SQL queries, it’s displayed in rows and rows of data. This tabular data cannot adequately preview how the network behaves. When presented with a dataset, it’s hard to infer what decision should be made at the company level. Humans are much better at processing images rather than plain data. Some research shows we are 60,000 times faster at processing images than text.
Visuals also extend the human capacity to take in, comprehend, and more efficiently synthesize large amounts of new information, especially to find patterns and relationships. Sometimes, an expert must react without hesitation to resolve an urgent issue in the network. In a case of a network outage, a quick analysis should be sufficient to identify the culprit node that caused the outage. In case of constraints breach in chemical analysis, regardless of whether there is too much material in one component or an imbalance of ingredients in the product, the expert needs a clear alert to react promptly.
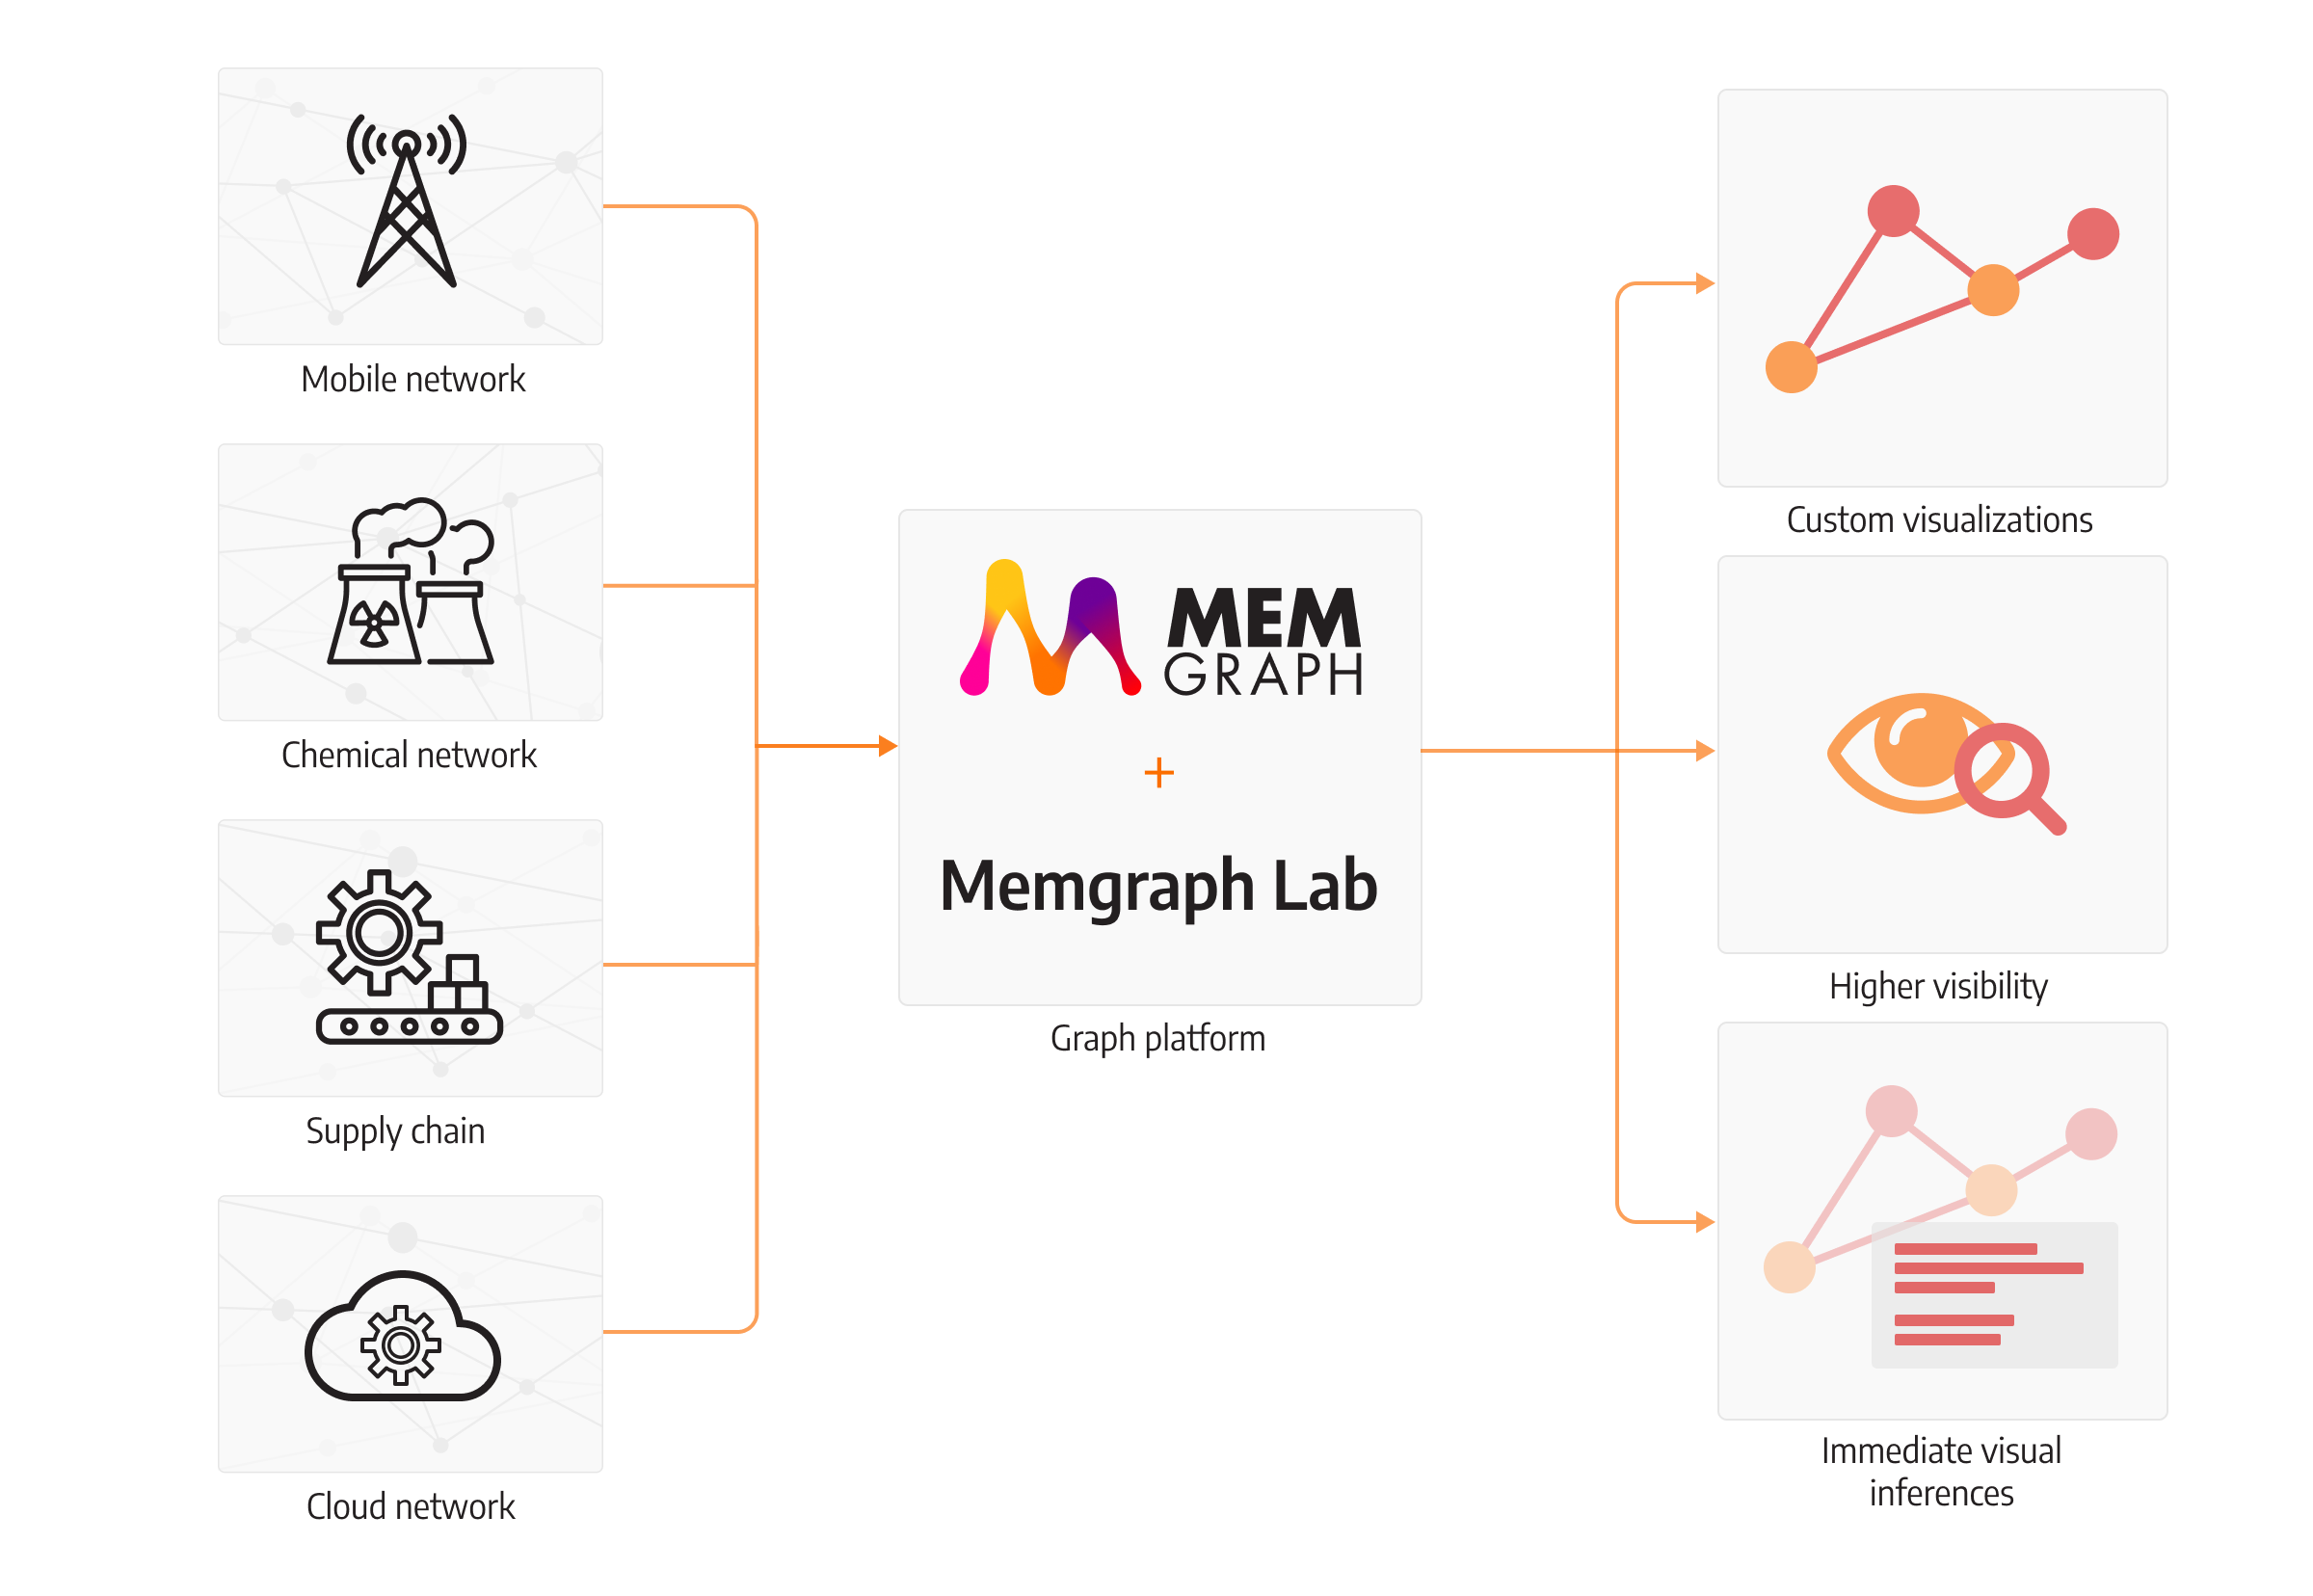
Memgraph Lab is a visualization tool that can render the current state of the graph in a matter of milliseconds. The extensive possibilities of customizations allow for making the best view for the user to make the most out of their perception skills. After all, software tools exist to suggest and advise experts on what is going on and provide several options. Experts should be able to perform a quick analysis and decide what’s the best course of action to improve and increase the efficiency of production, handle network outages, or deploy a team of repairmen to fix the bottleneck in the power grid.
Conclusion
With all that being said, Memgraph is a powerful solution capable of analyzing networks of highly connected data and giving instantaneous insights to end users. Some of the key features of Memgraph are its in-memory storage with a graph algorithm library at its disposal, capable of providing real-time insights using dynamical algorithms and showing custom visualizations. These are all tools necessary for dealing with problems in the chemical industry, supply chain management, telecommunications and cloud computing efficiently.